Ad Creative Testing Stats for 2026
Introduction
Only 5 to 8% of ads launched on Meta become real winners, and roughly half are turned off before they reach 28 days of spend (Motion, Creative Benchmarks 2026). 80% of marketers now use AI to help create content, and 75% use it for media production (HubSpot, State of Marketing 2026). At the same time, 41% of marketers say it still takes three to four weeks to launch a digital campaign from asset creation to execution (Smartly, 2026 Digital Advertising Trends Report).
We aggregated data from Motion's Creative Benchmarks 2026, HubSpot's State of Marketing 2026, Salesforce's State of Marketing (Tenth Edition), Smartly's 2026 Digital Advertising Trends Report, Triple Whale's 2025 Ecommerce Benchmarks, IAB's Internet Advertising Revenue Report, and dozens of other primary sources to compile this report.
The numbers below explain why creative volume — not creative cleverness — is the lever the largest accounts pull in 2026. Meta's Andromeda rollout has shifted ad delivery from audience targeting toward creative diversity, which means the brands that ship more variations win more often.
Key Takeaways
- Only 4 to 8% of ads on Meta become winners, depending on account spend tier (Motion, Creative Benchmarks 2026).
- Roughly 6% of ads capture the majority of spend in any given account (Motion, Creative Benchmarks 2026).
- Median advertisers ship 6 to 7 creatives per week; the top spend tier ships 12 to 19+ per week (Motion, Creative Benchmarks 2026).
- Conversion rates drop ~45% after four exposures to the same creative on Meta (cross-source frequency research).
- 80% of marketers now use AI for content creation (HubSpot, State of Marketing 2026).
- 46% of marketers use AI specifically to scale creative output (Smartly, 2026 Digital Advertising Trends Report).
- Meta CPMs rose 20% year-over-year in 2025 across roughly 35,000 ecommerce brands (Triple Whale, 2025 Ecommerce Benchmarks).
- TikTok ad CPMs climbed 16% year-over-year in 2025, while CVR slipped 6.2% (Triple Whale, 2025 Ecommerce Benchmarks).
- 9:16 video with audio, emotional storytelling, and human presence drives 16% lower CPA and 29% higher conversion rate, based on a Meta + AppsFlyer + Dentsu analysis of 1.1 million creative variations (Meta for Business, 2025).
- 76% of marketers report advertising effectiveness is weakened by ineffective creative or the inability to measure it (Forrester / VidMob, 2025).
- 86% of marketers have already seen AI outputs that resemble competitor content (Smartly, 2026 Digital Advertising Trends Report).
- The full report's methodology and source list is below.
1. Creative Volume and Testing Velocity Benchmarks
The single biggest lever in 2026 isn't a smarter hook. It's how many ads make it to the auction. Motion's analysis of $1.3 billion in Meta spend shows a clean correlation: accounts that ship more creatives find more winners, both in absolute count and in hit rate.
The implication is operational, not creative. If a $50K-per-month account ships 7 ads per week and a $1M-per-month account ships 19, the larger account is running roughly 2.7× the experiments at the same time — and converting more of them into scale.
| Metric | Value | Source |
|---|---|---|
| Median creatives shipped per week (mid-tier accounts) | 6–7 | Motion, Creative Benchmarks 2026 |
| Median creatives shipped per week (top spend tier) | 12–19+ | Motion, Creative Benchmarks 2026 |
| Total ads analyzed in benchmark dataset | 578,750 | Motion, Creative Benchmarks 2026 |
| Total ad spend covered | $1.29 billion | Motion, Creative Benchmarks 2026 |
| Advertiser accounts in dataset | 6,015 | Motion, Creative Benchmarks 2026 |
| Marketers who say it takes 3–4 weeks to launch a campaign | 41% | Smartly, 2026 Digital Advertising Trends Report |
| Marketers who can launch a campaign in under one week | 3.6% | Smartly, 2026 Digital Advertising Trends Report |
| Marketers concerned 30% of marketing budget is wasted | Most respondents | Smartly, 2026 Digital Advertising Trends Report |
Outlier worth flagging: the gap between median and top-tier output isn't a function of bigger creative teams alone. The top quartile of accounts within each spend tier consistently ships more creatives than that tier's median, even controlling for budget (Motion, Creative Benchmarks 2026). Output is a process choice, not a headcount choice.
Source: Motion, Creative Benchmarks 2026.
2. Winner Concentration and Hit Rates
Winners are rare and concentrated. Across Motion's dataset, a creative is classified as a winner when it spends at least 10× the account median, with a $500 minimum threshold (Motion, Creative Benchmarks 2026). By that definition, only a small fraction of every account's portfolio earns its keep.
The takeaway for budgeting: stop allocating evenly across new launches and stop killing losers slowly. Plan for a long tail of small tests and a tight head of large allocations to the few outliers that prove themselves.
| Metric | Value | Source |
|---|---|---|
| Share of creatives that become "winners" (micro spend tier) | 3.8% | Motion, Creative Benchmarks 2026 |
| Share of creatives that become winners (enterprise tier) | 8.2% | Motion, Creative Benchmarks 2026 |
| Share of creatives classified as "losers" (turned off before 28 days) | ~50–53% | Motion, Creative Benchmarks 2026 |
| Share of creatives classified as "mid-range" (28+ days, never a winner) | 38–46% | Motion, Creative Benchmarks 2026 |
| Share of total spend captured by winning ads | ~55% | Motion, Creative Benchmarks 2026 |
| Share of total spend captured by mid-range ads | ~28% | Motion, Creative Benchmarks 2026 |
| Share of total spend captured by losing ads | ~17% | Motion, Creative Benchmarks 2026 |
| Winner spend share at micro accounts vs enterprise accounts | 23% vs 64% | Motion, Creative Benchmarks 2026 |
| Approximate hit rate for the lowest tier | ~4% | Motion, Creative Benchmarks 2026 |
| Approximate hit rate for the top tier | ~9% | Motion, Creative Benchmarks 2026 |
The winner-share gap is the most telling number in the table. At the micro tier, winners capture 23% of spend; at enterprise, 64%. Bigger accounts don't just have more winners — they ride them harder and longer once identified, because their attribution and decisioning tooling is faster.
Source: Motion, Creative Benchmarks 2026 — Key Benchmarks & Insights.
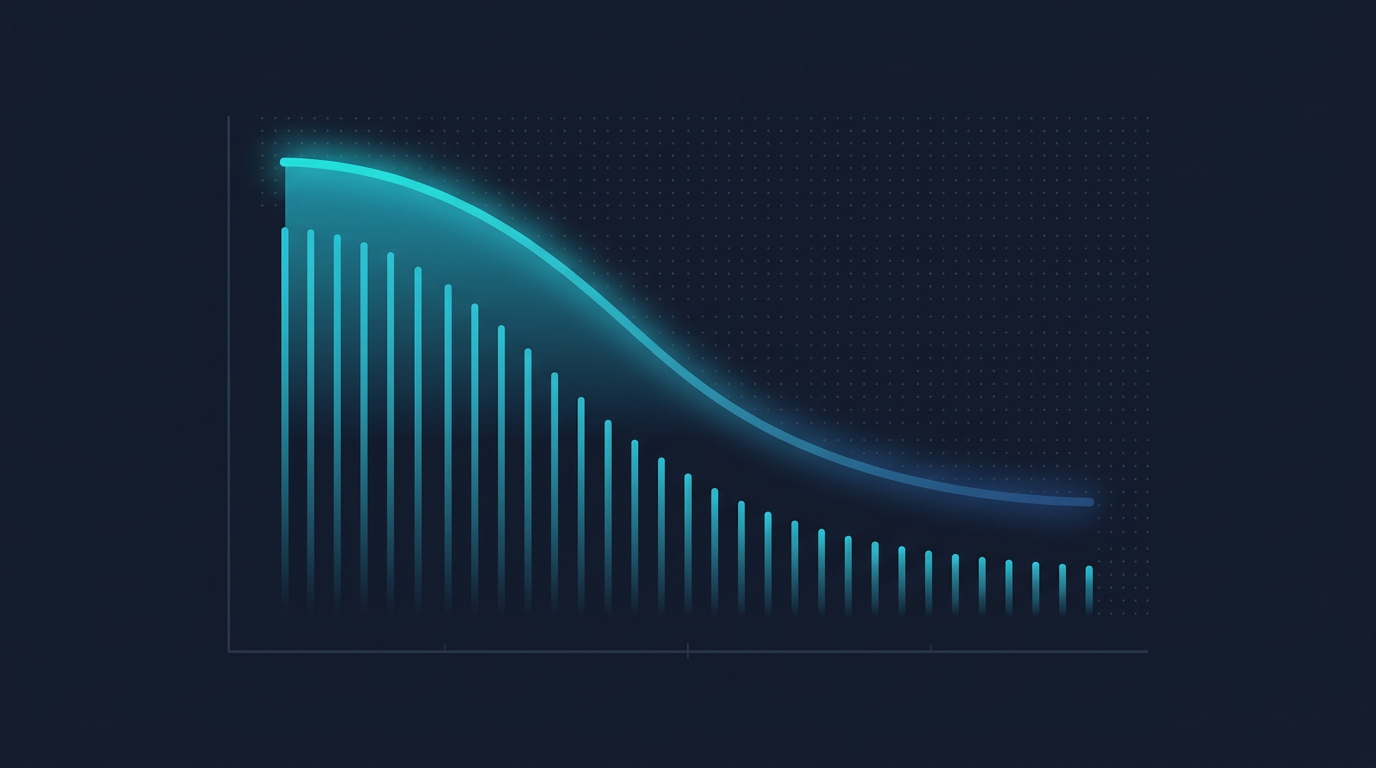
3. Creative Fatigue and Decay
Fatigue isn't a feeling — it's a measurable decay curve. Meta's own Analytics team has published research showing that ads degrade with repeated exposure to the same visual elements, distinct from broader audience saturation, and that following its fatigue guidance lifted conversion rates by an average of 8% in high-fatigue cases (Analytics at Meta, 2024).
The consequence: refresh cadence isn't a creative preference, it's an arithmetic requirement. Most creatives in Motion's dataset never reach 28 days of spend. The brands that thrive don't run ads longer — they replace them faster.
| Metric | Value | Source |
|---|---|---|
| Conversion rate drop after 4 exposures to the same creative | ~45% | Cross-source frequency research (AdAmigo, 2026) |
| CTR drop after 5–8 views of the same creative | ~50% | Cross-source frequency research (AdAmigo, 2026) |
| Cost increase at 5+ exposures | 50–80% | Cross-source frequency research (AdAmigo, 2026) |
| Share of an ad's impact that lands within first 2 exposures | ~80% | Cross-source frequency research (AdAmigo, 2026) |
| Frequency above which prospecting decay is "almost guaranteed" | 2.5–3.0 | Koro, 2025 Ad Fatigue on Instagram |
| Conversion lift Meta saw from following its fatigue guidance | +8% | Analytics at Meta, 2024 |
| Optimal weekly frequency for cold prospecting | 1–3 | AdAmigo, 2026 |
| Typical TikTok creative lifespan before fatigue | 7–10 days | Cross-source TikTok creative reporting (Segwise, 2026) |
| Typical Meta creative lifespan before noticeable fatigue | 14–21 days | Cross-source Meta creative reporting (Revel, 2025) |
The TikTok–Meta gap matters for planning. TikTok creatives fatigue 2 to 3 times faster than Meta, which is why advertisers pushing $10K+ per month on TikTok need three to five fresh concepts per week to hold scale (Segwise, 2026). Most teams aren't producing at that cadence, which is why ad operations infrastructure — not just creative — is the bottleneck.
Source: Analytics at Meta, "Creative Fatigue".
4. AI vs Human Creative Performance
AI adoption inside the creative production stack moved from "experimenting" to "operating" between 2024 and 2026. The headline numbers are large and consistent across surveys. But underneath the adoption headlines, three distinct sub-stories matter for performance: who's adopting, where speed gains are real, and whether the output actually performs.
4.1 AI Adoption by Marketers
Adoption has crossed the majority threshold across every major State-of-Marketing study in the past 12 months. The interesting variance is in what kind of AI work — copy and image generation are routine, but agentic and end-to-end campaign automation are still on the leading edge.

| Metric | Value | Source |
|---|---|---|
| Marketers using AI for content creation | 80% | HubSpot, State of Marketing 2026 |
| Marketers using AI for media production | 75% | HubSpot, State of Marketing 2026 |
| Marketers who have adopted AI overall | 75% | Salesforce, State of Marketing (Tenth Edition) |
| Marketers using AI to scale creative specifically | 46% | Smartly, 2026 Digital Advertising Trends Report |
| Marketers running AI across creative, media, and measurement | 33% | Smartly, 2026 Digital Advertising Trends Report |
| Marketers who say AI is the biggest disruption to marketing in 20 years | 61% | HubSpot, State of Marketing 2026 |
| Marketers who have adopted agentic AI | 13% | Salesforce, State of Marketing (Tenth Edition) |
Sample size matters here. HubSpot surveyed 1,500+ global marketers, Salesforce surveyed approximately 4,450 marketers globally, and Smartly drew from 450 senior marketers across the US, UK, and Germany. Triangulating across the three, the realistic adoption floor for AI in some part of the creative process is 75 to 80% in 2026.
Source: HubSpot, State of Marketing 2026.
4.2 AI Production Speed and Throughput
The speed claims are the easiest part of the AI story to verify. Smartly's research with Reach3 found that 41% of marketers still take three to four weeks to launch a campaign — but 95% are now testing AI for creative production specifically to compress that cycle (Smartly, 2026 Digital Advertising Trends Report). When the production engine speeds up, the launch engine becomes the bottleneck.

| Metric | Value | Source |
|---|---|---|
| Marketers testing AI for creative production | 95% | Smartly, 2026 Digital Advertising Trends Report |
| Generative AI users who classify their use as "initial testing" | 42% | Smartly, 2026 Digital Advertising Trends Report |
| Marketers who say it takes 1+ month to learn a new AI platform | 30% | Smartly, 2026 Digital Advertising Trends Report |
| Hours per quarter Sprout's social team saved with AI workflow automation | 72 | Sprout Social, AI in Social Media Guide 2026 |
| Time savings on creative reporting and analysis (cited average) | 50%+ | Sprout Social, AI in Social Media Guide 2026 |
| Time required for TikTok Symphony Creative Studio to assemble an ad from a product URL | Under 60 seconds | TikTok, Symphony Creative Studio 2026 |
The operational point is that speed gains in production expose lag elsewhere. If your team can now generate 50 ad variations in an afternoon, the constraint becomes upload, naming, UTM, and platform handoff — exactly the work a bulk ad launcher absorbs. The fastest creative pipeline in the world doesn't matter if Ads Manager is still a per-ad clickthrough.
Source: Smartly, 2026 Digital Advertising Trends Report.
4.3 AI Performance, Risk, and Sameness
This is the part of the AI conversation where the numbers get sharp. Speed gains are real, but the cost is creative homogenization — and the audience can tell.

| Metric | Value | Source |
|---|---|---|
| Marketers concerned AI-generated creative makes brands look the same | ~75% (3 in 4) | Smartly, 2026 Digital Advertising Trends Report |
| Marketers who have already seen AI outputs resembling competitor content | 86% | Smartly, 2026 Digital Advertising Trends Report |
| Consumers who prioritize human-generated content from brands | #1 priority | Sprout Social, 2026 Social Media Content Strategy Report |
| Marketers who can only measure creative effectiveness post-media-flight | 32% | Forrester (commissioned by VidMob), 2025 |
| Marketers who say current creative testing is time-intensive, costly, or nonexistent | 45% | Forrester (commissioned by VidMob), 2025 |
| Marketers who report ad effectiveness is weakened by ineffective creative or its measurement | 76% | Forrester (commissioned by VidMob), 2025 |
| Marketers who believe AI-driven creative pretesting will help meet goals | 70% | Forrester (commissioned by VidMob), 2025 |
| Marketers who want AI to assign creative quality scores before ads run | 69% | Forrester (commissioned by VidMob), 2025 |
The performance counterpoint: when AI is used as a creative diversity engine rather than a content factory, results show up. American Eagle reported a 60% lift in ROAS using TikTok Symphony's features versus standard assets (TikTok, Symphony case studies 2026). Meta's Andromeda system, fully rolled out in October 2025, shows 8 to 10% average performance improvements when campaigns are correctly structured for creative diversity (Meta for Business, 2025).
Source: Forrester, "Creative Effectiveness" (commissioned by VidMob, 2025).
5. Platform-Specific Creative Benchmarks: Meta vs TikTok
Hook rates, CTRs, and completion rates are platform-native metrics — they aren't directly comparable, because each platform measures different windows. TikTok counts a 2-second view; Meta counts 3-second. With that caveat acknowledged, the cross-source benchmark distributions tell consistent stories about where the elite creative bar sits.
| Metric | Meta | TikTok | Source |
|---|---|---|---|
| Median hook rate | 28% (Feed) / 31% (Reels) | 33% | Cross-source benchmark (Benly.ai, 12,000+ ad analysis 2026) |
| Top 10% hook rate | 43–50% | ~55% | Cross-source benchmark (Benly.ai, 2026) |
| Median video CTR | 1.62% | 0.84% | Cross-source benchmark (Benly.ai, 2026) |
| Median video completion rate | 18% | 24% | Cross-source benchmark (Benly.ai, 2026) |
| Median CPM (ecommerce, 2025) | $14.19 | $13.26 | Triple Whale, 2025 Ecommerce Benchmarks |
| Median CPA (ecommerce, 2025) | $38.19 | $32.74 | Triple Whale, 2025 Ecommerce Benchmarks |
| Median CVR (ecommerce, 2025) | 1.6% | 2.01% | Triple Whale, 2025 Ecommerce Benchmarks |
| Median ROAS (ecommerce, 2025) | 1.86 | 2.21 | Triple Whale, 2025 Ecommerce Benchmarks |
| YoY CPM change (ecommerce, 2025) | +20% | +16% | Triple Whale, 2025 Ecommerce Benchmarks |
| Lift from 9:16 video with audio, emotional storytelling, human presence, text overlays | −16% CPA, +29% CVR, +11% reach | — | Meta + AppsFlyer + Dentsu Creative, 1.1M creative analysis 2025 |
Outlier worth flagging: TikTok's 234% intra-vertical ROAS spread dwarfs Meta's, meaning product-category fit drives more variance on TikTok than on Meta (Triple Whale, 2025 Ecommerce Benchmarks). Brands that win on TikTok aren't necessarily better creators — they're often selling the right product to a young, low-friction discovery audience.
Source: Triple Whale, 2025 Ecommerce Benchmarks. For format-fit checks, AdLiftr's free ad creative size and safe zone checker flags placement issues before launch.
6. Testing Methodology and Budget Allocation
Once you accept that 5 to 8% of ads will be winners, the rest of the testing system has to be built around that reality. Andromeda's October 2025 rollout reframed the question from "who should we target?" to "which ad should we serve?" — which means budget allocation now follows creative diversity rather than audience segmentation.
| Metric | Value | Source |
|---|---|---|
| Increase in Andromeda model capacity vs prior systems | 10,000× | Meta for Business, 2025 |
| Improvement in Andromeda feature extraction latency | 100× | Meta for Business, 2025 |
| Average performance lift from correctly structured Andromeda campaigns | 8–10% | Meta for Business, 2025 |
| Reported ROAS lift for some advertisers post-Andromeda rollout | Up to 22% | The MTM Agency, 2025 (referencing Meta data) |
| Lower CPA on Advantage+ sales campaigns | 9% | Meta for Business, 2025 |
| Marketers who consider AI implementation their top priority and top challenge | #1 in both | Salesforce, State of Marketing (Tenth Edition) |
| Marketers completely satisfied with their data unification | 26% | Salesforce, State of Marketing (Tenth Edition) |
| Marketers with unified data who are more likely to use AI agents | +60% | Salesforce, State of Marketing (Tenth Edition) |
The budget rule that follows from this: build for many small tests, then redirect aggressively toward whatever wins. Motion's data shows that at the enterprise tier, 64% of spend already goes to winning ads (Motion, Creative Benchmarks 2026). At the micro tier, only 23% does. Closing that gap is less about prediction and more about reaction speed — which is why teams that automate refresh and reallocation outperform teams that decide creative-by-creative each week. Our bulk creative testing solution guide walks through the exact 8-step workflow.
Source: Meta for Business, "Unlocking the Power of Diversification with Meta Andromeda".
7. Creative Operations and Team Workflows
The operational layer between "creative made" and "ad launched" is where most of the creative testing thesis breaks down. The same Smartly study that puts 95% of marketers in the AI creative production camp also says 30% of them need a month or more to onboard a new AI tool, and 41% still take three to four weeks to launch a campaign. Production is fast; ops is slow.

| Metric | Value | Source |
|---|---|---|
| Marketers who say it takes 3–4 weeks to launch a digital campaign | 41% | Smartly, 2026 Digital Advertising Trends Report |
| Marketers who can launch in under one week | 3.6% | Smartly, 2026 Digital Advertising Trends Report |
| Marketers who say 30% of marketing budget is wasted | Most respondents | Smartly, 2026 Digital Advertising Trends Report |
| Social marketers who have integrated AI tools into workflows | 71% | Sprout Social, Index Q2 2023 baseline |
| Social marketers who report positive AI outcomes | 82% | Sprout Social, Index Q2 2023 baseline |
| Marketers who worry about proving ROI from social efforts | 68% | Hootsuite, Social Media Trends 2024 |
| Share of US digital ad revenue captured by social media advertising in 2025 | 40% | IAB / PwC, Internet Advertising Revenue Report Full Year 2025 |
| YoY growth in social media advertising revenue (US, 2025) | +32.6% | IAB / PwC, Internet Advertising Revenue Report Full Year 2025 |
| US digital ad revenue total, 2025 | $294.6 billion | IAB / PwC, Internet Advertising Revenue Report Full Year 2025 |
The pattern across these numbers is consistent: the bottleneck has moved from "can we make 50 ad variations?" to "can we launch them with consistent naming, UTMs, Post IDs, and Spark codes by Friday?" This is exactly the operational problem AdLiftr solves — bulk-uploading 100+ ad variations across Meta and TikTok in 60 seconds with deterministic naming, UTM, and Post ID handling. The same template-and-launch logic powers our free Meta and TikTok bulk upload template generator.
Source: IAB, Internet Advertising Revenue Report Full Year 2025.
Ad Creative Testing by the Numbers: Summary Table
| Metric | Value | Source |
|---|---|---|
| Share of ads that become winners (cross-tier average) | 5–8% | Motion, Creative Benchmarks 2026 |
| Share of ads turned off before 28 days | ~50–53% | Motion, Creative Benchmarks 2026 |
| Share of ads capturing the majority of spend | ~6% | Motion, Creative Benchmarks 2026 |
| Share of total spend going to winning creatives | ~55% | Motion, Creative Benchmarks 2026 |
| Median weekly creative output (mid-tier) | 6–7 | Motion, Creative Benchmarks 2026 |
| Median weekly creative output (top tier) | 12–19+ | Motion, Creative Benchmarks 2026 |
| Hit rate at the lowest spend tier | ~4% | Motion, Creative Benchmarks 2026 |
| Hit rate at the top spend tier | ~9% | Motion, Creative Benchmarks 2026 |
| Conversion drop after 4 same-creative exposures | ~45% | AdAmigo, Cross-source 2026 |
| CTR drop after 5–8 exposures | ~50% | AdAmigo, Cross-source 2026 |
| Marketers using AI for content creation | 80% | HubSpot, State of Marketing 2026 |
| Marketers using AI to scale creative output | 46% | Smartly, 2026 Digital Advertising Trends Report |
| Marketers who say AI risks brand sameness | ~75% | Smartly, 2026 Digital Advertising Trends Report |
| Marketers who have seen AI outputs resemble competitor content | 86% | Smartly, 2026 Digital Advertising Trends Report |
| Median Meta hook rate (Feed / Reels) | 28% / 31% | Benly.ai, Cross-platform benchmark 2026 |
| Median TikTok hook rate | 33% | Benly.ai, Cross-platform benchmark 2026 |
| Top 10% TikTok hook rate | ~55% | Benly.ai, Cross-platform benchmark 2026 |
| Median Meta CPM (ecommerce, 2025) | $14.19 | Triple Whale, 2025 Ecommerce Benchmarks |
| Median TikTok CPM (ecommerce, 2025) | $13.26 | Triple Whale, 2025 Ecommerce Benchmarks |
| YoY Meta CPM change (ecommerce, 2025) | +20% | Triple Whale, 2025 Ecommerce Benchmarks |
| Andromeda performance lift (correctly structured campaigns) | 8–10% | Meta for Business, 2025 |
| 9:16 video with audio + storytelling + human presence | −16% CPA, +29% CVR | Meta + AppsFlyer + Dentsu, 1.1M creatives 2025 |
Methodology and Sources
This roundup prioritizes Tier 1 primary research — original surveys, platform-published reports, and disclosed-methodology benchmark studies — and cross-references market and performance figures across at least two independent sources where possible. We flag any figure older than three years as "most recent available." All cited stats reflect data from 2024–2026 unless otherwise noted; benchmark distributions sourced from third-party aggregators are clearly labeled and refer back to the underlying advertiser dataset.
Sources cited:
- Motion, Creative Benchmarks 2026 (analysis of 578,750 ads, 6,015 advertiser accounts, $1.29B in spend, Sept 2025–Jan 2026).
- HubSpot, State of Marketing 2026 (1,500+ global marketers).
- Salesforce, State of Marketing (Tenth Edition, ~4,450 marketers globally).
- Smartly, 2026 Digital Advertising Trends Report (450 senior marketers, US/UK/Germany).
- Triple Whale, 2025 Ecommerce Benchmarks Report (~35,000 brands).
- Meta for Business, "Unlocking the Power of Diversification with Meta Andromeda" (2025).
- Meta + AppsFlyer + Dentsu Creative, 1.1 million creative variation analysis (2025).
- Analytics at Meta, "Creative Fatigue: How advertisers can improve performance by managing repeated exposures" (2024).
- Forrester (commissioned by VidMob), Creative Effectiveness Research (2025).
- Sprout Social, 2026 Social Media Content Strategy Report and Index data (2025–2026).
- Hootsuite, Social Media Trends 2024 / 2026.
- IAB / PwC, Internet Advertising Revenue Report — Full Year 2025.
- TikTok, Symphony Creative Studio product page and case studies (2026).
- Benly.ai, Ad Creative Benchmarks 2026 (cross-platform analysis of 12,000+ ads).
- AdAmigo, Meta Ads Frequency Benchmarks (2026).
- Segwise, Best AI Tools for TikTok Ads in 2026.
- Revel Marketing Partners, Ad Fatigue on Meta (2025).
Last updated: April 2026. We update this page quarterly with the latest data.
Free 7-Day Trial
Turn the guide into a launch workflow for Meta, TikTok, Google & Snapchat.
- Bulk launch to Meta, TikTok, Google Ads and Snapchat
- Reusable campaign and CSV templates
- 7-day free trial, no credit card required